Pi Room - Spectrum Analyzer
Last week, we found two HP spectrum analyzers in storage, and we decided to put one out in the Pi room. Spectrum analyzers are useful for visualizing the spectral power of a signal, with applications for RF/wireless systems, radar, audio analysis, noise characterization, and many more.
The basic idea is that a spectrum analyzer will show power vs. frequency of a signal, where the signal is decomposed into a sum of sinusoids at different frequencies. For example, if you’re designing a filter and would like to see how a certain input signal is attenuated in the frequency domain at it’s output, a spectrum analyzer is perfect to take measurements and characterize how the system behaves.
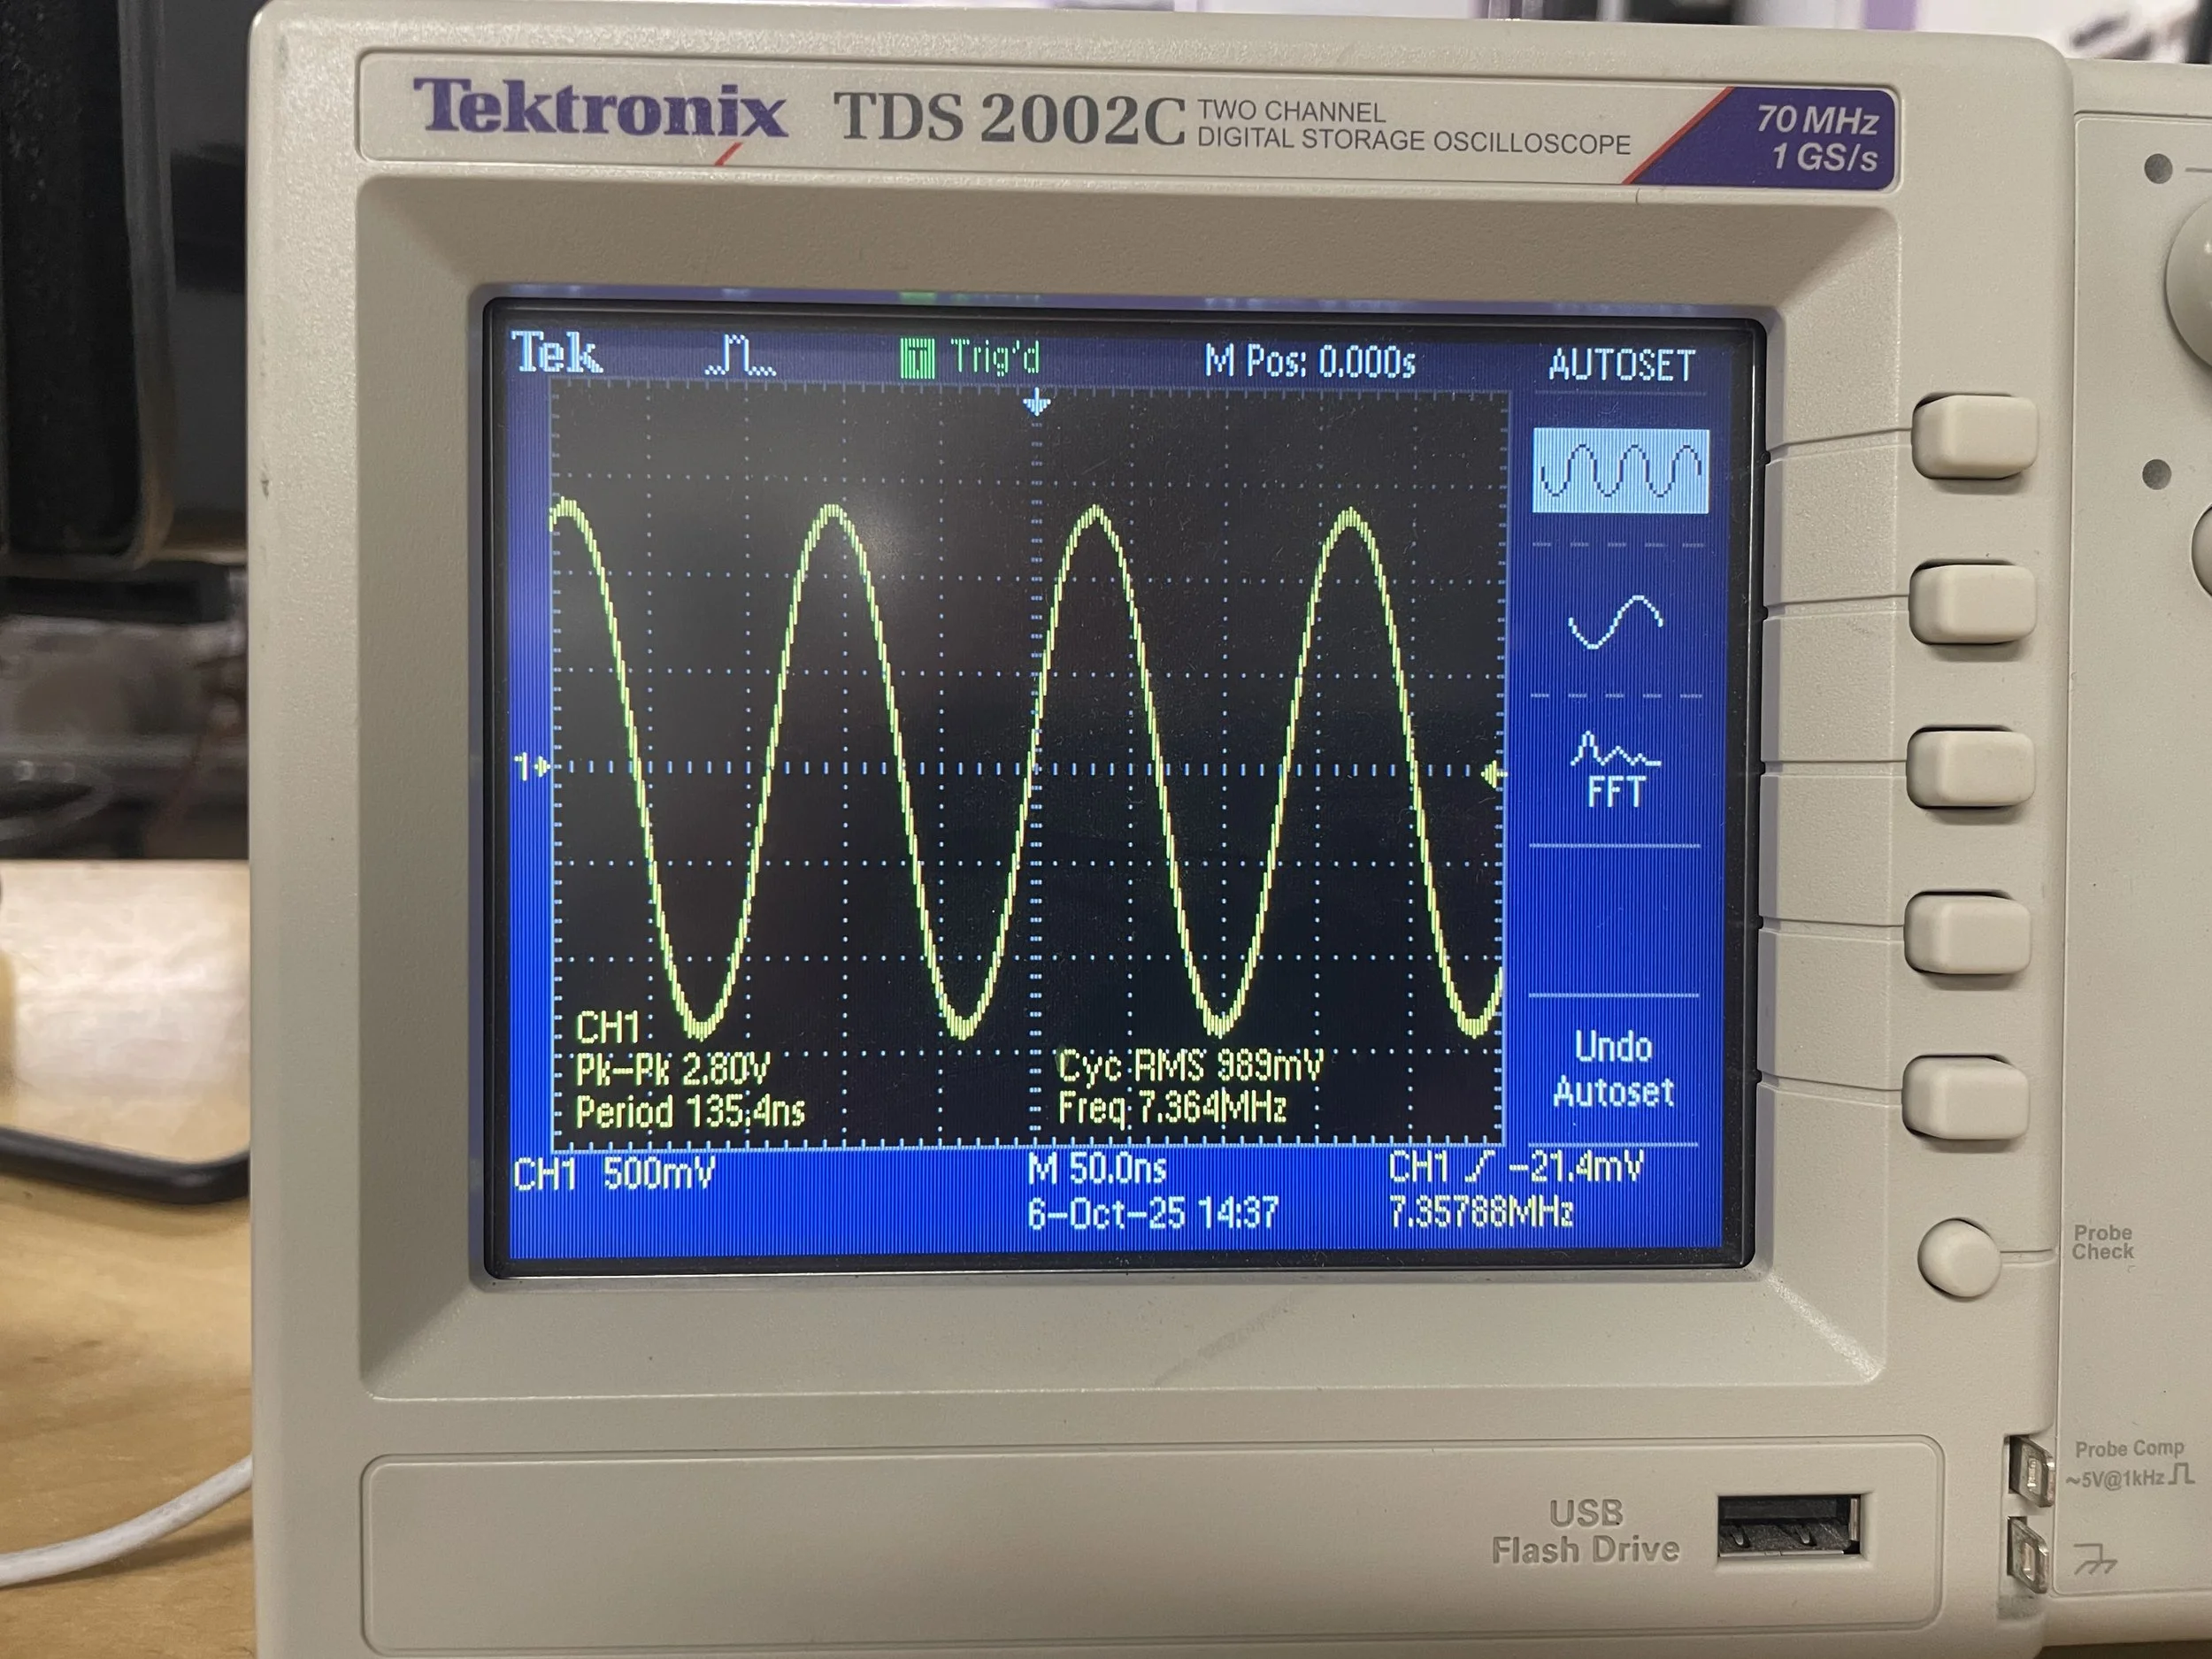
Sine wave from function generator, 7.35MHz
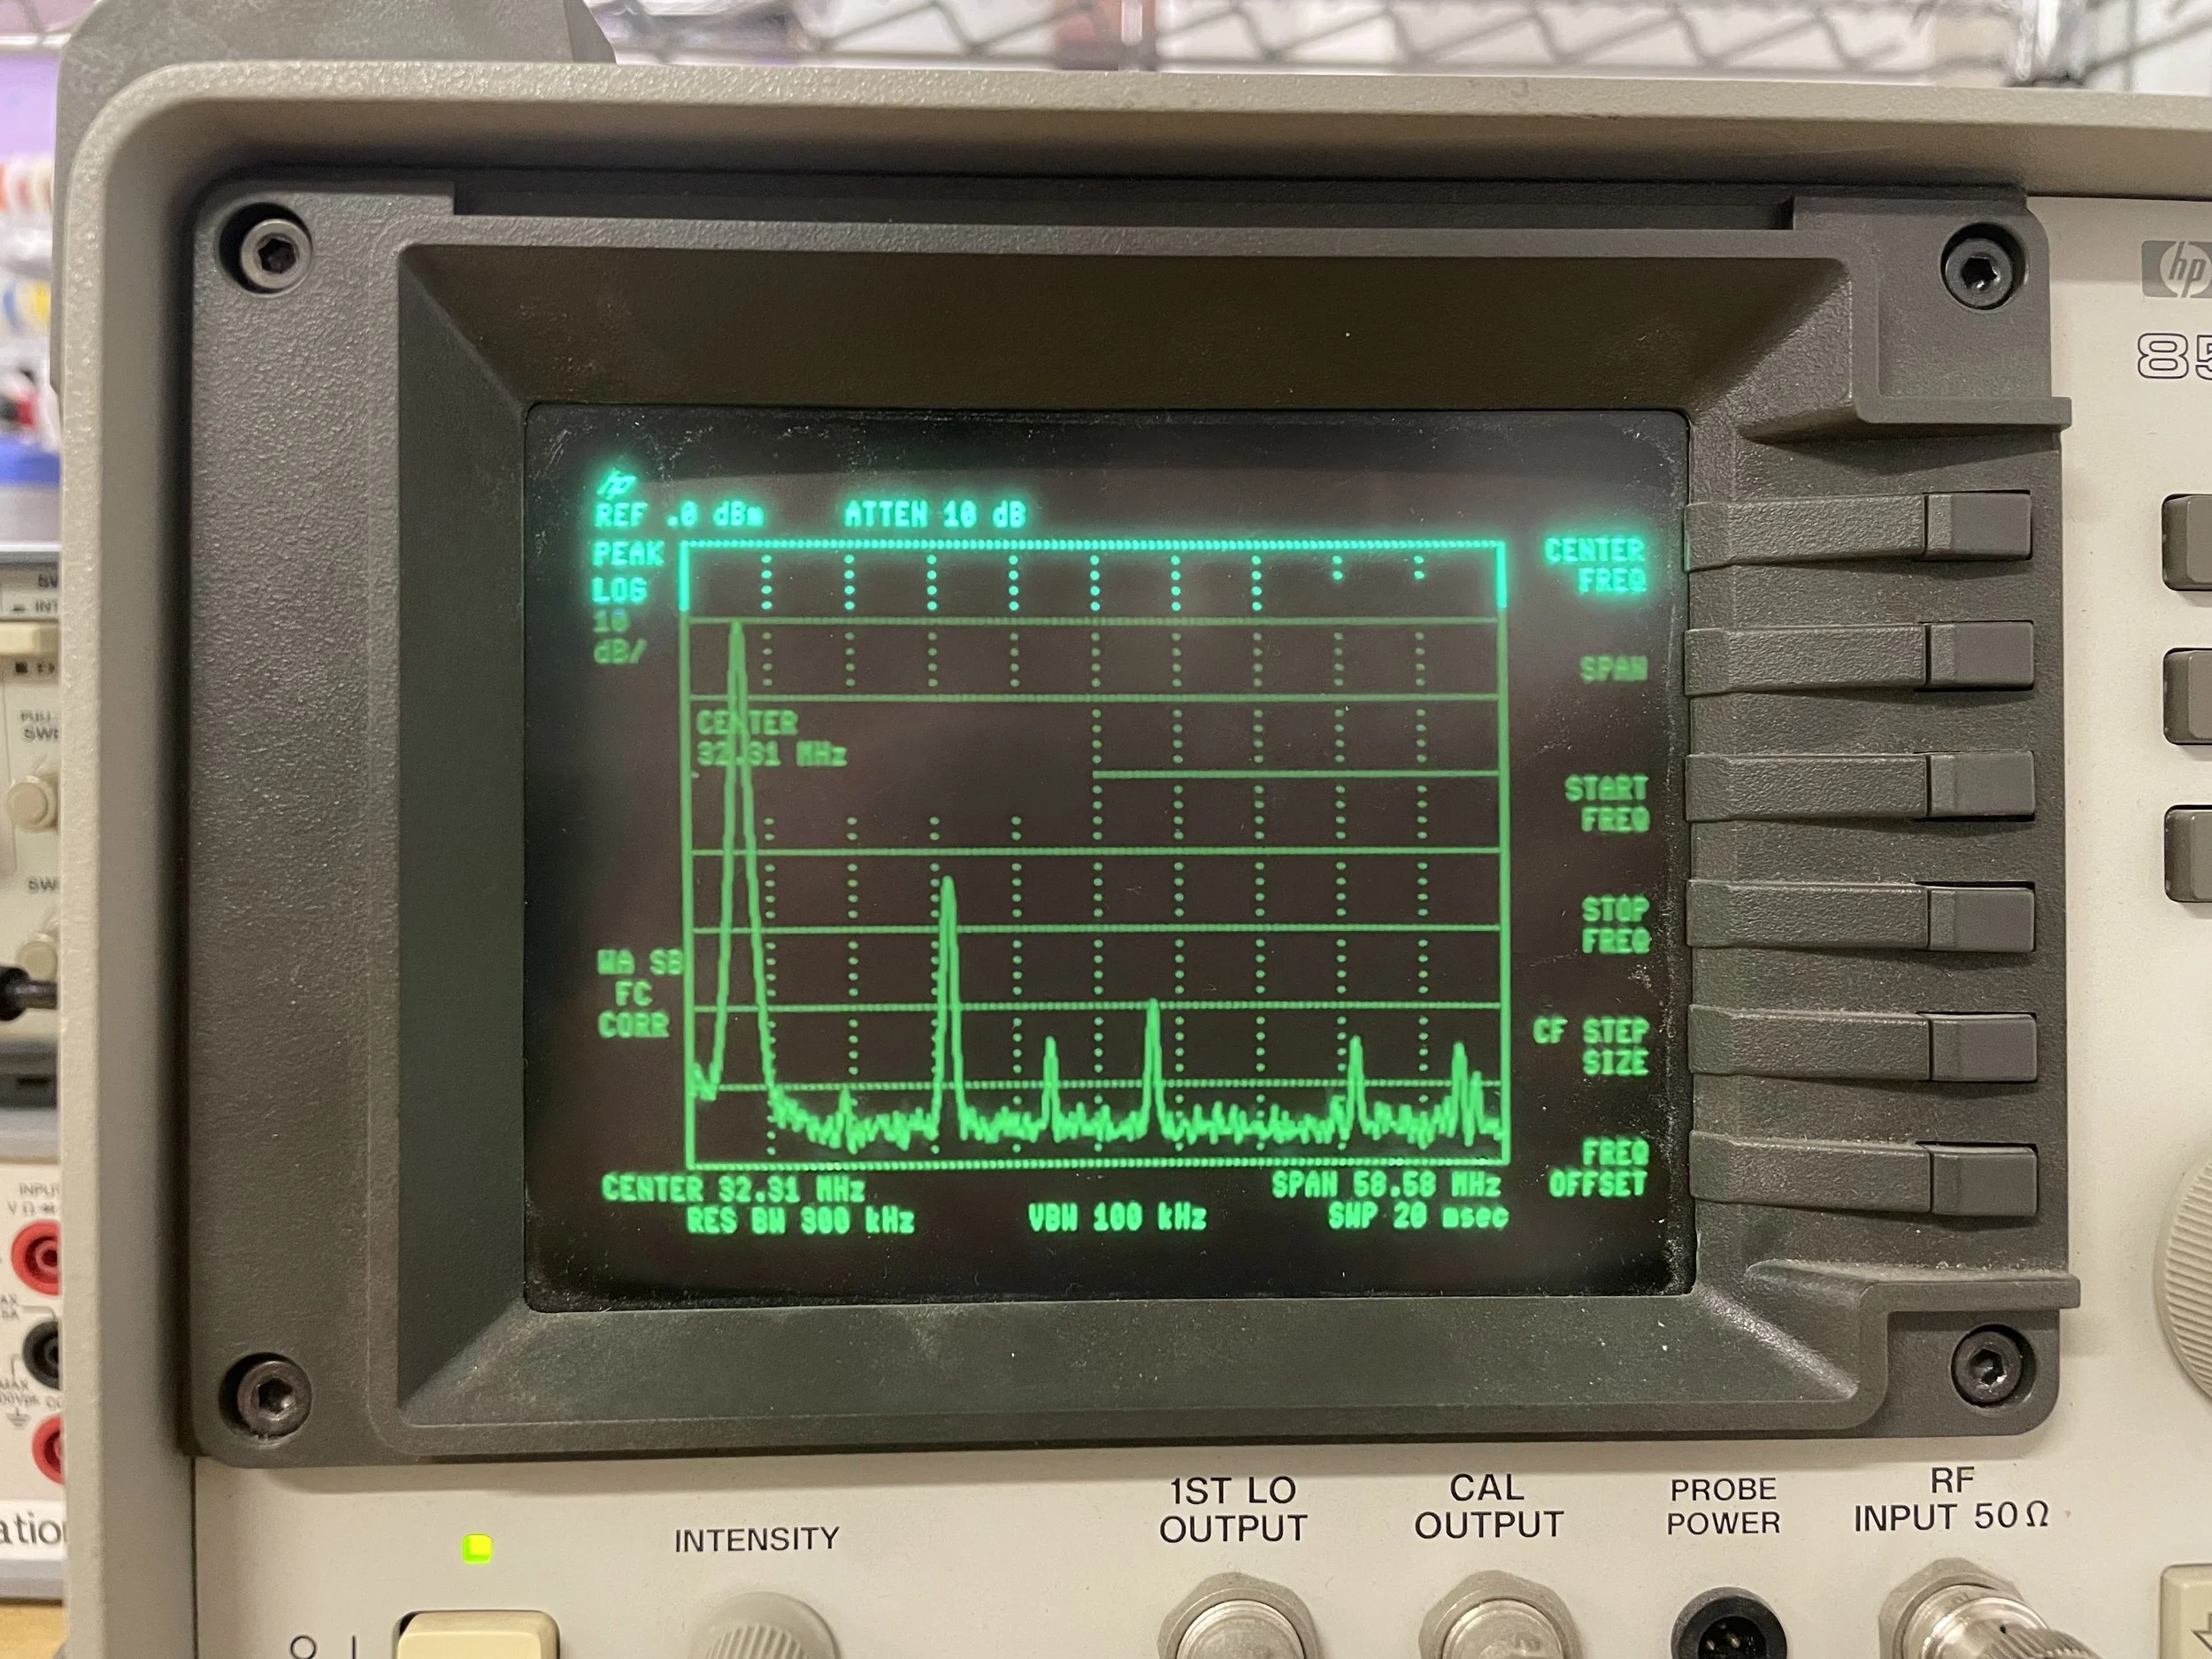
Spectral power of above signal
Here, I used a function generator to input a sine wave into the analyzer. Generally speaking, a perfect sine wave at our target frequency should only have power at that frequency - but, the plot above shows some details of how a sine wave is generated. On older function generators such as used above, a sine wave is generally a square wave passed through a low pass filter. So, some of the spectral artifacts from the square wave show up on our spectral plot, showing that the input signal is not a perfect sinusoid. These peaks are usually referred to as harmonics.
Here is a short video of the spectrum response as the frequency of the input signal is swept from 7 to 11MHz.